There’s More Downside Potential on the S&P Chart, But How Much?
As published on MarketWatch Trading Deck November 2, 2016:
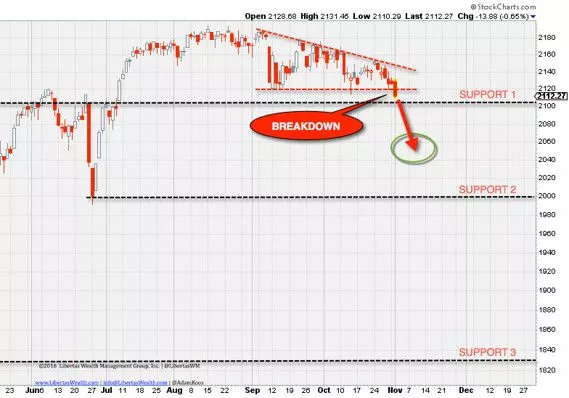
Tuesday, the S&P 500 SPX, +0.62% broke back below metaphorical line in the sand — under the May 2015 all-time highs that created so much buzz when surpassed this past July. In addition, and more importantly in the short term, the market also broke down through the lower level of the descending-triangle pattern that I mentioned last week.
The bearish development began in September, and these types of chart patterns don’t typically produce false breakdowns, so this one should be respected. (More details on the psychology and a little education on both the pattern and psychology behind it can be found in the column linked above.)
The breakdown can be seen in the chart below, along with three levels of support below current prices. It’s unlikely the first floor will hold. There is too much negative momentum beneath the surface of mere market prices. So now what?

Long-term trends still remain positive, with intermediate- and short-term trends showing a negative bias. What’s most important is that those longer-term trends (as defined by the 252-day exponential moving average) remain positive through the next week or two. Assuming this is the case, the market will provide investors with a nice entry point that tastes a lot like the Brexit.
I don’t anticipate we’re going to see the kind of drop in prices that we experienced at the Brexit. Rather, I think we’ll see the market struggle over the next week and find a bottom somewhere between “Support 1” and “Support 2” as seen on the chart. I drew an arrow with a circle, denoting the approximate range in which I think the S&P 500 could rediscover some lift beneath its wings.
Should the market fall and close through Support 2 for a couple days, the last line of defense on the chart is the February low, but again, I don’t see these levels being reached unless we get a huge surprise out of the U.S. election next week or some unforeseen geopolitical event.
So kick back, relax, enjoy the fall weather, turn on the World Series, and remain cash heavy and/or extremely hedged in your investment accounts. I think the market is going to show us where it wants to go a week from now. The descending-triangle breakdown observed above will likely add additional volatility and downside pressure to the markets over the coming days, and there’s too much risk out there to be throwing money around.

